------------------------
This presentation about the national debt is about the worst we've ever read. The author completely ignores real numbers, relevant facts, and common sense in an effort to explain what he clearly doesn't understand.
The author's leftist bonafides start showing relatively quickly as he employs all the typical leftist tropes regarding the national debt and various Republicans.
And, he repeatedly confuses the national debt with the deficit.
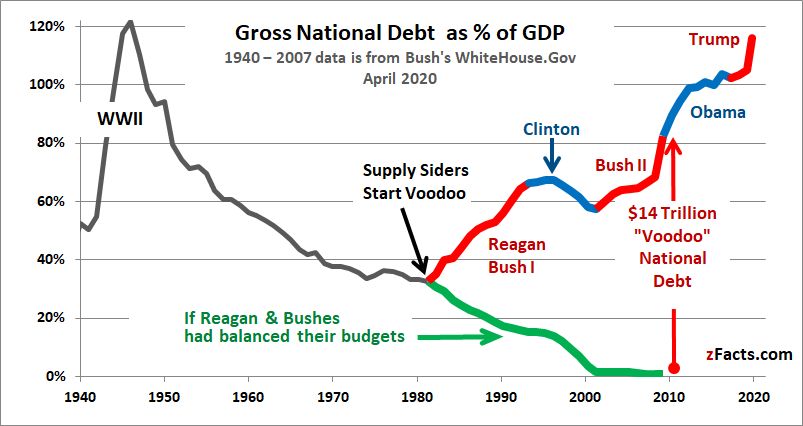
National Debt Graph
Here’s how national-debt policy was captured by Wall Street and went crazy. You can see exactly when it happened in this graph. You can even see George H.W. Bush predict it in the video clip below when he was running against Reagan — and then take it back when he became Reagan’s choice for VP.
World War II was looming, and the country was flat broke. But Uncle Sam was popular, the country patriotic, and all were happy to lend him money. Compared to the size of the economy back then, the debt soon outstripped even today’s debt, and we won the war. Then, without any to-do, we almost paid it off, until … (Figures don't lie, but liars figure. The size of the economy is able to conceal a lot of debt when expressed as a percentage of GDP. Notice that the above graph is based the percentage of GDP.
Those are not real numbers.
Here's the real numbers:
Notice that the last time the national debt actually decreased was 1956. That is, the year's expenditures were less than the income. But the national debt still existed, albeit slightly lower than the previous year.
| END OF FISCAL YEAR | DEBT (IN BILLIONS, ROUNDED) | DEBT-TO-GDP RATIO | MAJOR EVENTS BY PRESIDENTIAL TERM |
|---|---|---|---|
| 1929 | $17 | 16% | Market crash |
| 1930 | $16 | 17% | Smoot-Hawley reduced trade |
| 1931 | $17 | 22% | Dust Bowl drought raged |
| 1932 | $20 | 34% | Hoover raised taxes |
| 1933 | $23 | 40% | New Deal increased GDP and debt |
| 1934 | $27 | 40% | |
| 1935 | $29 | 39% | Social Security |
| 1936 | $34 | 40% | Tax hikes renewed depression |
| 1937 | $36 | 39% | Third New Deal |
| 1938 | $37 | 42% | Dust Bowl ended |
| 1939 | $40 | 51% | Depression ended |
| 1940 | $43 | 49% | FDR increased spending and raised taxes |
| 1941 | $49 | 44% | U.S. entered WWII |
| 1942 | $72 | 48% | Defense tripled |
| 1943 | $137 | 70% | |
| 1944 | $201 | 91% | Bretton Woods |
| 1945 | $259 | 114% | WWII ended |
| 1946 | $269 | 119% | Truman's 1st term budgets and recession |
| 1947 | $258 | 103% | Cold War |
| 1948 | $252 | 92% | Recession |
| 1949 | $253 | 93% | Recession |
| 1950 | $257 | 86% | Korean War boosted growth and debt |
| 1951 | $255 | 74% | |
| 1952 | $259 | 71% | |
| 1953 | $266 | 68% | Recession when war ended |
| 1954 | $271 | 69% | Eisenhower's budgets and Recession |
| 1955 | $274 | 64% | |
| 1956 | $273 | 61% | |
| 1957 | $271 | 57% | Recession |
| 1958 | $276 | 58% | Eisenhower's 2nd term and recession |
| 1959 | $285 | 55% | Fed raised rates |
| 1960 | $286 | 54% | Recession |
| 1961 | $289 | 52% | Bay of Pigs |
| 1962 | $298 | 50% | JFK budgets and Cuban missile crisis |
| 1963 | $306 | 48% | U.S. aids Vietnam, JFK killed |
| 1964 | $312 | 46% | LBJ's budgets and war on poverty |
| 1965 | $317 | 43% | U.S. entered Vietnam War |
| 1966 | $320 | 40% | |
| 1967 | $326 | 40% | |
| 1968 | $348 | 39% | |
| 1969 | $354 | 36% | Nixon took office |
| 1970 | $371 | 35% | Recession |
| 1971 | $398 | 35% | Wage-price controls |
| 1972 | $427 | 34% | Stagflation |
| 1973 | $458 | 33% | Nixon ended gold standard and OPEC oil embargo |
| 1974 | $475 | 31% | Watergate and budget process created |
| 1975 | $533 | 32% | Vietnam War ended |
| 1976 | $620 | 33% | Stagflation |
| 1977 | $699 | 34% | Stagflation |
| 1978 | $772 | 33% | Carter budgets and recession |
| 1979 | $827 | 32% | |
| 1980 | $908 | 32% | Volcker raised fed rate to 20% |
| 1981 | $998 | 31% | Reagan tax cut |
| 1982 | $1,142 | 34% | Reagan increased spending |
| 1983 | $1,377 | 37% | Jobless rate 10.8% |
| 1984 | $1,572 | 38% | Increased defense spending |
| 1985 | $1,823 | 41% | |
| 1986 | $2,125 | 46% | Reagan lowered taxes |
| 1987 | $2,350 | 48% | Market crash |
| 1988 | $2,602 | 50% | Fed raised rates |
| 1989 | $2,857 | 51% | S&L Crisis |
| 1990 | $3,233 | 54% | First Iraq War |
| 1991 | $3,665 | 58% | Recession |
| 1992 | $4,065 | 61% | |
| 1993 | $4,411 | 63% | Omnibus Budget Act |
| 1994 | $4,693 | 64% | Clinton budgets |
| 1995 | $4,974 | 64% | |
| 1996 | $5,225 | 64% | Welfare reform |
| 1997 | $5,413 | 63% | |
| 1998 | $5,526 | 60% | LTCM crisis and recession |
| 1999 | $5,656 | 58% | Glass-Steagall repealed |
| 2000 | $5,674 | 55% | Budget surplus |
| 2001 | $5,807 | 55% | 9/11 attacks and EGTRRA |
| 2002 | $6,228 | 57% | War on Terror |
| 2003 | $6,783 | 59% | JGTRRA and Iraq War |
| 2004 | $7,379 | 60% | Iraq War |
| 2005 | $7,933 | 61% | Bankruptcy Act and Hurricane Katrina. |
| 2006 | $8,507 | 61% | Bernanke chaired Fed |
| 2007 | $9,008 | 62% | Bank crisis |
| 2008 | $10,025 | 68% | Bank bailout and QE |
| 2009 | $11,910 | 82% | Bailout cost $250B ARRA added $242B |
| 2010 | $13,562 | 90% | ARRA added $400B, payroll tax holiday ended, Obama Tax cuts, ACA, Simpson-Bowles |
| 2011 | $14,790 | 95% | Debt crisis, recession and tax cuts reduced revenue |
| 2012 | $16,066 | 99% | Fiscal cliff |
| 2013 | $16,738 | 99% | Sequester, government shutdown |
| 2014 | $17,824 | 101% | QE ended, debt ceiling crisis |
| 2015 | $18,151 | 100% | Oil prices fell |
| 2016 | $19,573 | 105% | Brexit |
| 2017 | $20,245 | 104% | Congress raised the debt ceiling |
| 2018 | $21,516 | 105% | Trump tax cuts |
| 2019 | $22,719 | 107% | Trade wars |
| 2020 | $27,748 | 129% | COVID-19 and 2020 recession |
| 2021 | $29,617 | 124% | COVID-19 and American Rescue Plan Act |
| 2022 | $30,824 | 123% | Inflation Reduction Act and student loan forgiveness |
Notice that the last time the national debt actually decreased was 1956. That is, the year's expenditures were less than the income. But the national debt still existed, albeit slightly lower than the previous year.
Ever since 1956 the national debt increased. We most certainly never "almost paid it off." Not even close. Bringing the DEFICIT below zero in 1956 is not the same thing as paying off the DEBT. )
Something weird happened. (Weird?)
When Ronald Reagan became president, he rode to office on complaints of an “out-of-control debt” that was as big as “a stack of $1000 bills 67 miles high.” And in eight years in office he added another 125 miles to that stack! (No, he did not. Only the House of Representatives has the constitutional power to appropriate money. And that's what it did, spend oodles and oodles of money it did not have.)
As the graph shows, the national debt was actually at its lowest point in 50 years compared to the US economy, but Reagan grew the debt much faster than he grew the economy. (No, It was Congress that grew the debt. It went on a spending spree far exceeding the substantial increases in revenue yielded by the Reagan tax cuts:
As the graph shows, the national debt was actually at its lowest point in 50 years compared to the US economy, but Reagan grew the debt much faster than he grew the economy. (No, It was Congress that grew the debt. It went on a spending spree far exceeding the substantial increases in revenue yielded by the Reagan tax cuts:
| FISCAL YEAR | REVENUE |
|---|---|
| FY 2023 | $4.44 trillion |
| FY 2022 | $4.90 trillion |
| FY 2021 | $4.05 trillion |
| FY 2020 | $3.42 trillion |
| FY 2019 | $3.46 trillion |
| FY 2018 | $3.33 trillion |
| FY 2017 | $3.32 trillion |
| FY 2016 | $3.27 trillion |
| FY 2015 | $3.25 trillion |
| FY 2014 | $3.02 trillion |
| FY 2013 | $2.78 trillion |
| FY 2012 | $2.45 trillion |
| FY 2011 | $2.30 trillion |
| FY 2010 | $2.16 trillion |
| FY 2009 | $2.11 trillion |
| FY 2008 | $2.52 trillion |
| FY 2007 | $2.57 trillion |
| FY 2006 | $2.41 trillion |
| FY 2005 | $2.15 trillion |
| FY 2004 | $1.88 trillion |
| FY 2003 | $1.78 trillion |
| FY 2002 | $1.85 trillion |
| FY 2001 | $1.99 trillion |
| FY 2000 | $2.03 trillion |
| FY 1999 | $1.83 trillion |
| FY 1998 | $1.72 trillion |
| FY 1997 | $1.58 trillion |
| FY 1996 | $1.45 trillion |
| FY 1995 | $1.35 trillion |
| FY 1994 | $1.26 trillion |
| FY 1993 | $1.15 trillion |
| FY 1992 | $1.09 trillion |
| FY 1991 | $1.06 trillion |
| FY 1990 | $1.03 trillion |
| FY 1989 | $991.1 billion |
| FY1988 | $909.2 billion |
| FY 1987 | $854.3 billion |
| FY 1986 | $769.2 billion |
| FY 1985 | $734.0 billion |
| FY 1984 | $666.4 billion |
| FY 1983 | $600.6 billion |
| FY 1982 | $617.8 billion |
| FY 1981 | $599.3 billion |
| FY 1980 | $517.1 billion |
Unfortunately this chart is in reverse order. But we can see that when Reagan assumed office revenue was $517.7 billion, and when he left it had grown to $991 billion. But spending increased from $908 billion to $2.857 trillion!
Clearly the problem is spending, not tax cuts.)
That’s why the graph shoots up when he takes office. No one had done that since Word War II, and Reagan had promised to balance the budget. That’s weird. (Only weird if one is a leftist who cannot or will not look at the numbers and make the obvious conclusion that government has a spending problem, not a revenue problem.)
But one guy saw it coming and said so loud and clear. And years later, this first-class Republicn (sic) would say he was voting for Hillary Clinton (09/19/16). His name is George H. W. Bush, the 41st president of the United States. ("First -class?" Really? The Left hated H. W. Bush as president. The mocked him and vilified him.
But one guy saw it coming and said so loud and clear. And years later, this first-class Republicn (sic) would say he was voting for Hillary Clinton (09/19/16). His name is George H. W. Bush, the 41st president of the United States. ("First -class?" Really? The Left hated H. W. Bush as president. The mocked him and vilified him.
But now he's "first -class," but only because he happened to line up with a leftist objective.)
He called Reagan’s plan Voodoo economics, and when it came to the debt, that Voodoo made a zombie out of Reagan and generations of Republicans. Unfortunately Bush lost the primary to Reagan, and Reagan made him vice president. So not long after he called Voodoo on Reagan, he had to deny he ever said it. It’s well worth 22 seconds of your time to watch this.
What is Voodoo Economics? (here’s more of the backstory)
Invented at a restaurant just off Wall Street by Wall Street journalists (and a kooky economist), its official name is “supply-side” economics. Don’t be fooled, in 40 years this has not become part of real economics. That’s because its central tenet is this:
You gotta admit that sounds pretty weird. (This is the third time the author has used the term "weird." But it's only weird if one is a leftist who cannot or will not look at the numbers and make the obvious conclusion that government has a spending problem, not a revenue problem.)
He called Reagan’s plan Voodoo economics, and when it came to the debt, that Voodoo made a zombie out of Reagan and generations of Republicans. Unfortunately Bush lost the primary to Reagan, and Reagan made him vice president. So not long after he called Voodoo on Reagan, he had to deny he ever said it. It’s well worth 22 seconds of your time to watch this.
What is Voodoo Economics? (here’s more of the backstory)
Invented at a restaurant just off Wall Street by Wall Street journalists (and a kooky economist), its official name is “supply-side” economics. Don’t be fooled, in 40 years this has not become part of real economics. That’s because its central tenet is this:
“You cut taxes, and the tax revenues increase.” —Voodoo Economics (Demonstrably and experientially true.)
You gotta admit that sounds pretty weird. (This is the third time the author has used the term "weird." But it's only weird if one is a leftist who cannot or will not look at the numbers and make the obvious conclusion that government has a spending problem, not a revenue problem.)
You also have to admit that if Reagan believed that, he surely would have cut taxes. And he did. If it turned out to be crazy (which it was) then tax revenues would actually have fallen, which they did. (Um, wrong. We remind the reader of the numbers from the above chart: Revenue was $517.7 billion when Reagan was elected, and when he left office revenue had grown to $991 billion.
The Left so completely believes its own fake narratives that they will directly and willfully spout lies.)
So Reagan proved Bush was right. Supply-side tax policy is voodoo.
With revenues down, the government was short of money and had to borrow like crazy, and the national debt went up. (The government was short of money because of unprecedented spending. Notice how the initial false assertion grows a subsequent train of false logic.)
But come on. Nobody really believes such nonsense, least of all our presidents. Well, maybe you should watch this eight-second video from 2006.
Yes, that’s George Bush II. By 2006 he should have known better. One month after taking office in 2001 with a plan to cut taxes, he said he would “retire nearly $1 trillion in debt over the next four years. … the largest debt reduction ever achieved by any nation at any time.” Instead, the national debt went up by $2 trillion. But he remained under the spell of voodoo economics. (Um, spending.)
The same thing happened to him as to Ronald Reagan. He cut taxes, believed tax revenues would increase, but surprise — tax revenues went down. ($1.03 trillion to $1.15 trillion is not a decrease.)
So the government had to borrow more. (Because it spent more than the increase.)
And the Debt, which had been going down, suddenly shot up. (The debt has not decreased since 1956.)
Once again it grew even faster than the economy and that’s why you see the graph going up in his first budget year.
Fool me once, shame on you. Fool me twice shame on me. Should we go for three times? You would think that after 20 years of Voodoo experiments turning out just like any sane person would expect, that at least the best and brightest Republicans would catch on. So here we are in 2015. Trust me again for 14 seconds and listen to Fiorina and Rubio.
As Carly says, this may seem crazy to you. But here are two of the brightest contenders in the 2016 Republican primaries repeating the same old Voodoo. When it comes to the debt, the GOP is the party of zombies. (Irony alert.
The national debt in perspective
Consider what it means when the graph says 100%. It means the national debt equals one year of Gross Domestic (National) Product (GDP). So if we used the full value of what the US produces for one year just to pay off that debt, that would just do it. And 50% means the debt would be paid off in six months of using the full output. (The author is actually talking about a tax increase that would take 50% of everyone's money. Can the author name a single time that increasing taxes lowered the national debt? Nope, because it has never happened.
And only about 1/4 of the national debt is owed to foreigners. Another 40% is owed to Americans, for example, pension plans own quite a bit of it. And the rest is owed by the US government’s “General Fund” to other Government Trust Funds, like the Social Security Trust Fund and the military’s pension fund. (The author let slip a little damning factoid. The government in its insatiable quest for more money has borrowed every single dollar from the Social Security trust fund. That system is as bankrupt as the government is.)
Stop with the doom and gloom. If, as conservatives fear, the Chinese tried to bankrupt us by cashing in all their treasury bonds, we could simply print the money and pay them. (No one can bankrupt the US by "cashing in" treasury bonds. They cannot be cashed in, they simply mature at the time interval specified by the bond.)
Fool me once, shame on you. Fool me twice shame on me. Should we go for three times? You would think that after 20 years of Voodoo experiments turning out just like any sane person would expect, that at least the best and brightest Republicans would catch on. So here we are in 2015. Trust me again for 14 seconds and listen to Fiorina and Rubio.
As Carly says, this may seem crazy to you. But here are two of the brightest contenders in the 2016 Republican primaries repeating the same old Voodoo. When it comes to the debt, the GOP is the party of zombies. (Irony alert.
We are now quite sure the author doesn't know the difference between the yearly deficits and the total national debt.)
The national debt in perspective
Consider what it means when the graph says 100%. It means the national debt equals one year of Gross Domestic (National) Product (GDP). So if we used the full value of what the US produces for one year just to pay off that debt, that would just do it. And 50% means the debt would be paid off in six months of using the full output. (The author is actually talking about a tax increase that would take 50% of everyone's money. Can the author name a single time that increasing taxes lowered the national debt? Nope, because it has never happened.
So, if "we used" everyone's money "we" could pay off the debt. The author will now attempt to give this truly stupid idea credibility...)
That sounds outlandishly huge, but consider a family making $100,000 a year that buys a $250,000 house with 20% down and takes a $200,000 mortgage. No one considers this unusual or risky. But that family would be off the top of the graph at 200%. It would take all they made for two years to pay off their debt. (A family must buy food, heat, transportation, and the other essentials of life. It cannot dedicate 100% of its income for two years to pay off the home mortgage. Therefore, it is indeed outlandish despite the author's protestations.)
That sounds outlandishly huge, but consider a family making $100,000 a year that buys a $250,000 house with 20% down and takes a $200,000 mortgage. No one considers this unusual or risky. But that family would be off the top of the graph at 200%. It would take all they made for two years to pay off their debt. (A family must buy food, heat, transportation, and the other essentials of life. It cannot dedicate 100% of its income for two years to pay off the home mortgage. Therefore, it is indeed outlandish despite the author's protestations.)
And the US has a slight advantage over most families. It can print money. So there is zero chance of default. (Holy moley. This author is truly clueless. Printing money is the cause of inflation. If government decided to pay off the deficit by printing money, it would destroy the economy and the lives of tens of millions of citizens.)
And only about 1/4 of the national debt is owed to foreigners. Another 40% is owed to Americans, for example, pension plans own quite a bit of it. And the rest is owed by the US government’s “General Fund” to other Government Trust Funds, like the Social Security Trust Fund and the military’s pension fund. (The author let slip a little damning factoid. The government in its insatiable quest for more money has borrowed every single dollar from the Social Security trust fund. That system is as bankrupt as the government is.)
Stop with the doom and gloom. If, as conservatives fear, the Chinese tried to bankrupt us by cashing in all their treasury bonds, we could simply print the money and pay them. (No one can bankrupt the US by "cashing in" treasury bonds. They cannot be cashed in, they simply mature at the time interval specified by the bond.)
Not a problem. (No, no, no. No! The author is an idiot if he believes printing money will solve any problem.)
And no, the high debt is not harming our credit. If you have bad credit, people will only loan you money at a high interest rate. Everyone in the world is willing to loan Uncle Sam money at almost zero interest. He’s got absolutely the best credit rating in the world.
Click for an explanation of the Green Line, balanced budgets, tax cuts and a bit of Keynesian stimulation.
Click for an explanation of the Green Line, balanced budgets, tax cuts and a bit of Keynesian stimulation.
No comments:
Post a Comment